FlowMatrix Pro
Read Every Timeframe at Once Before You Take Any Trade
Most traders check two or three indicators on one or two timeframes. That's not analysis — that's a partial picture. You see the 1H SuperTrend flip bullish and go long. What you didn't see: the 1D Open Interest is declining. The 4H CVD is net negative. RSI across every timeframe is in retracement. You just bought into distribution.
42 readings. One glance. Every bar.
What's Inside
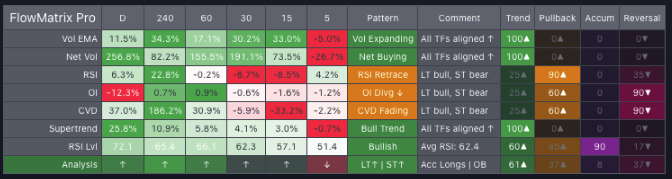
7 metrics × 6 timeframes
Vol EMA, Net Vol, RSI %, Open Interest, CVD, SuperTrend, RSI Level — all 42 cells color-coded and updated every bar
Situation Ratings (0–100)
Weighted composite scores for Trend, Pullback, Accumulation, and Reversal — dominant situation labeled automatically
Pattern column per row
Plain-English labels: "Acc Longs", "Short Cover", "Vol Expanding", "RSI Bullish" — readable in one second
LT / ST direction labels
Long-term direction (1D + 4H SuperTrend) and short-term label (Retrace / Bounce / ST Up / ST Down) updated live
Accumulation type detection
Identifies Acc Longs / Acc Shorts / Short Cover / Long Liquidation from OI × CVD relationship at 1H and 30m
JSON webhook alerts
Fires on dominant situation change — payload includes symbol, LT direction, ST label, accumulation type, all 4 situation scores
See It on Your Chart
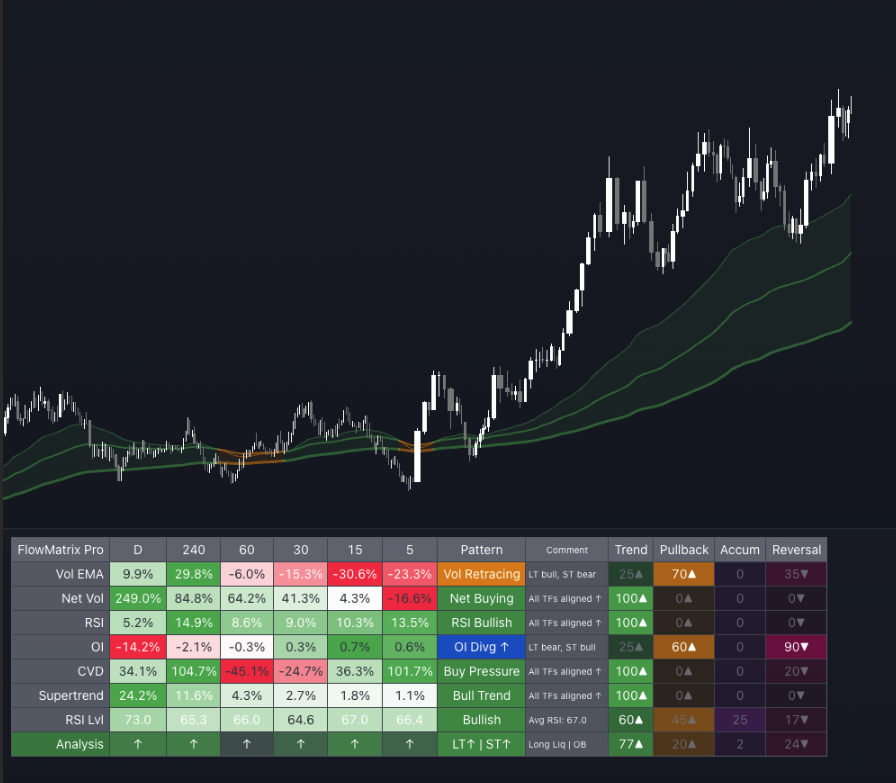
Trend score 91 — all 6 timeframes aligned bullish. CVD Buy Pressure, OI Accumulating, Vol Expanding. High-confidence setup.
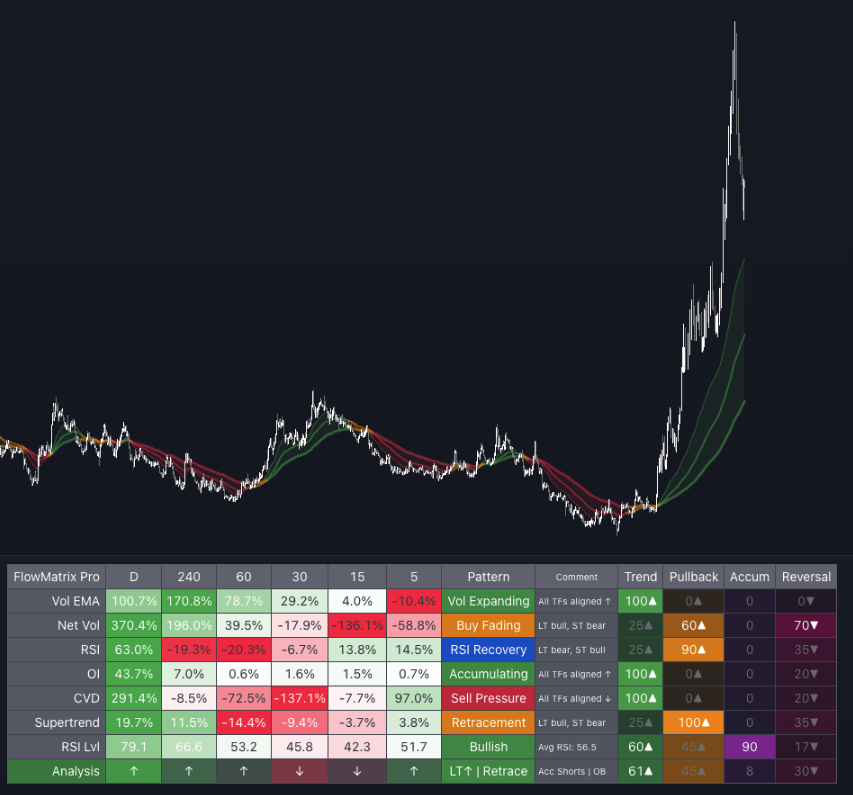
Pullback score 78 — LT↑ / Retrace. Net Vol fading, OI distributing — classic long pullback entry setup.
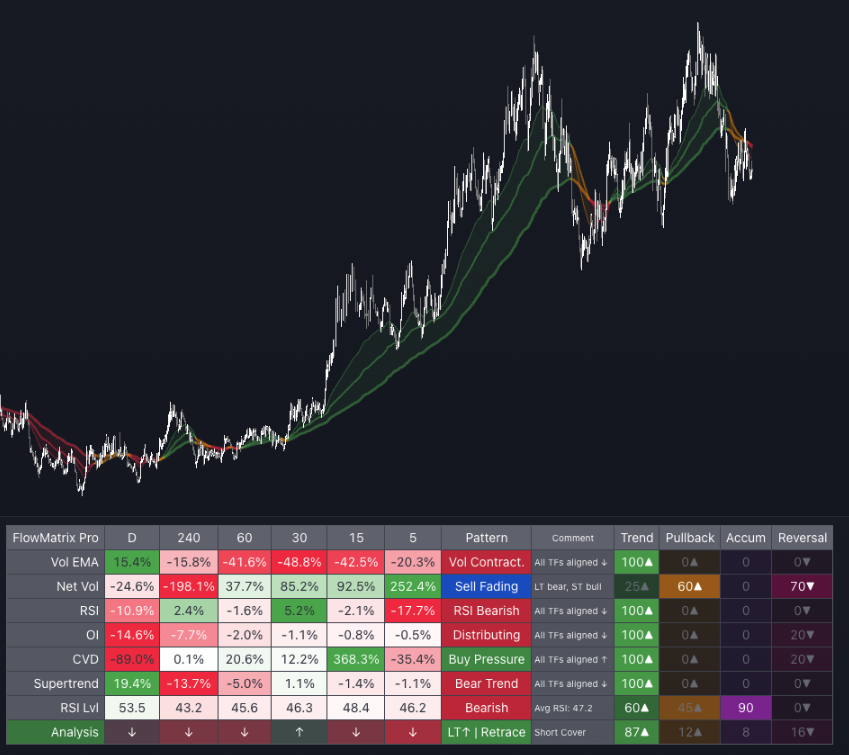
Bearish alignment — all timeframes confirm distribution. Dominant situation fires webhook alert.
Why Traders Use It
- See the complete market picture in one glance — 42 data points without switching charts or timeframes
- Never buy distribution again — OI + CVD + Net Vol combined tell you exactly who is executing and in which direction
- Catch pullback entries before they turn — the Pullback score identifies LT bull + ST bear systematically, not by feel
- Automate your analysis workflow — JSON webhook fires when the dominant situation changes
- Used live in CSJ9 institutional fund operations — the exact multi-TF scanner the fund uses for regime shifts and accumulation zones
FAQ
Add your TradingView username at checkout — access granted within 1–3 hours
You Might Also Need
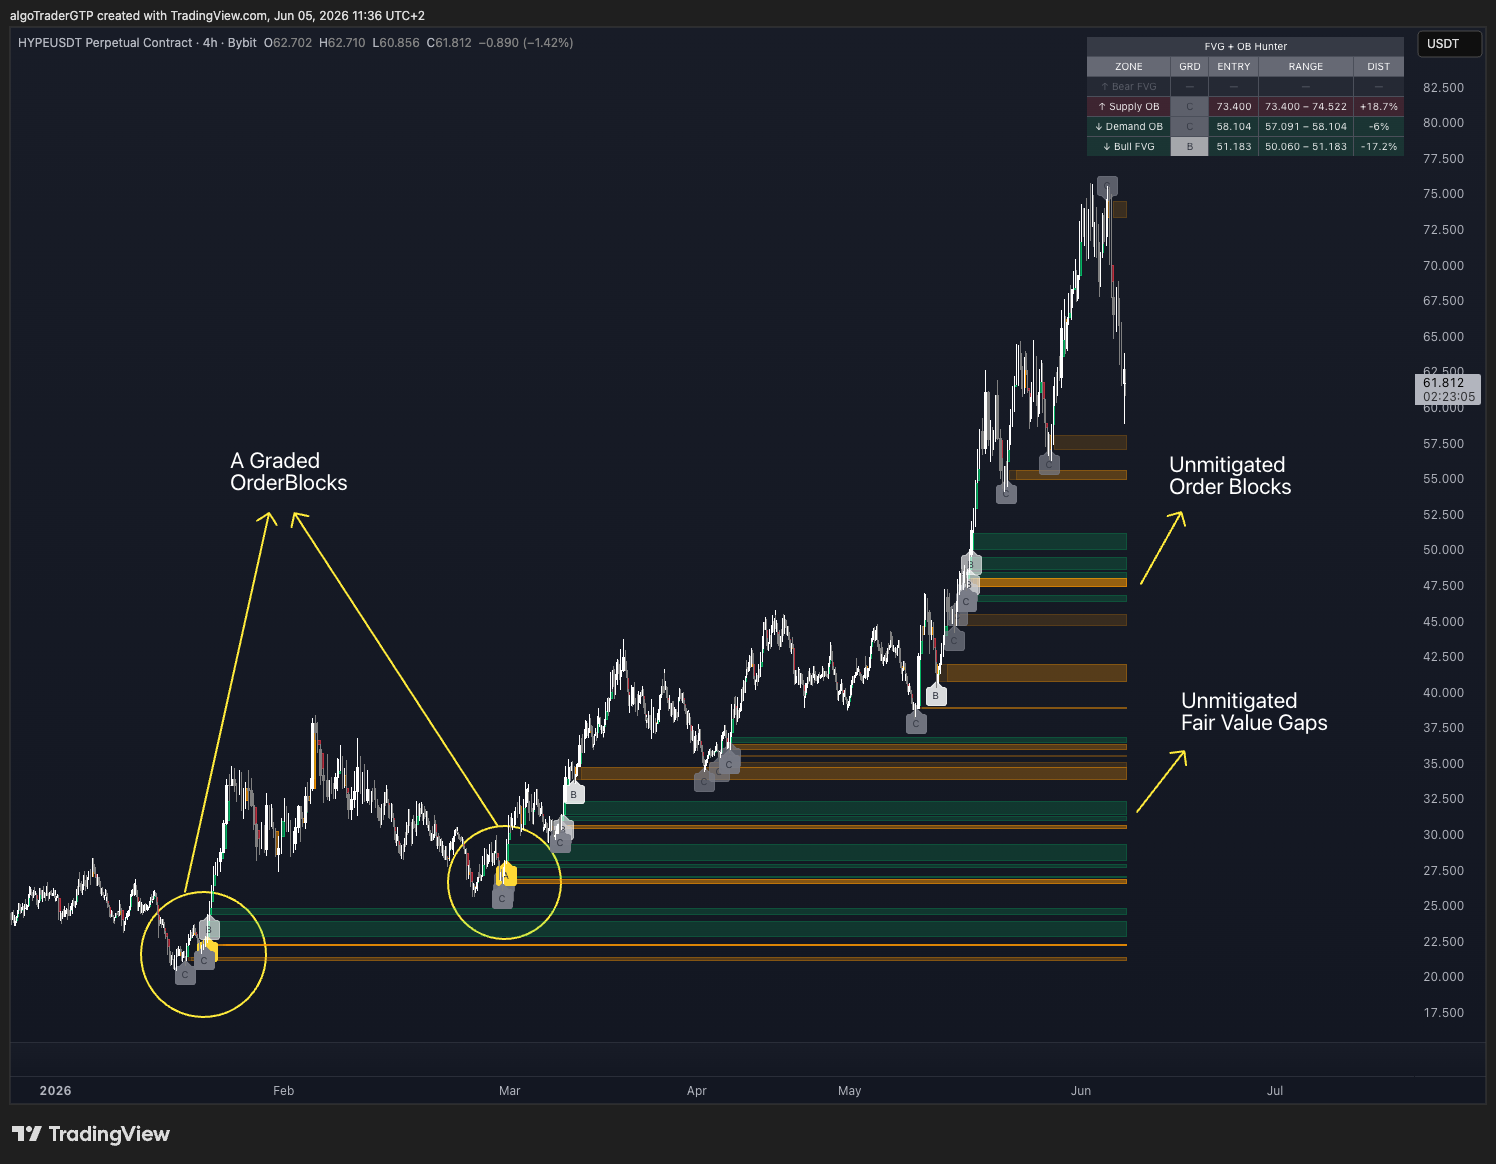
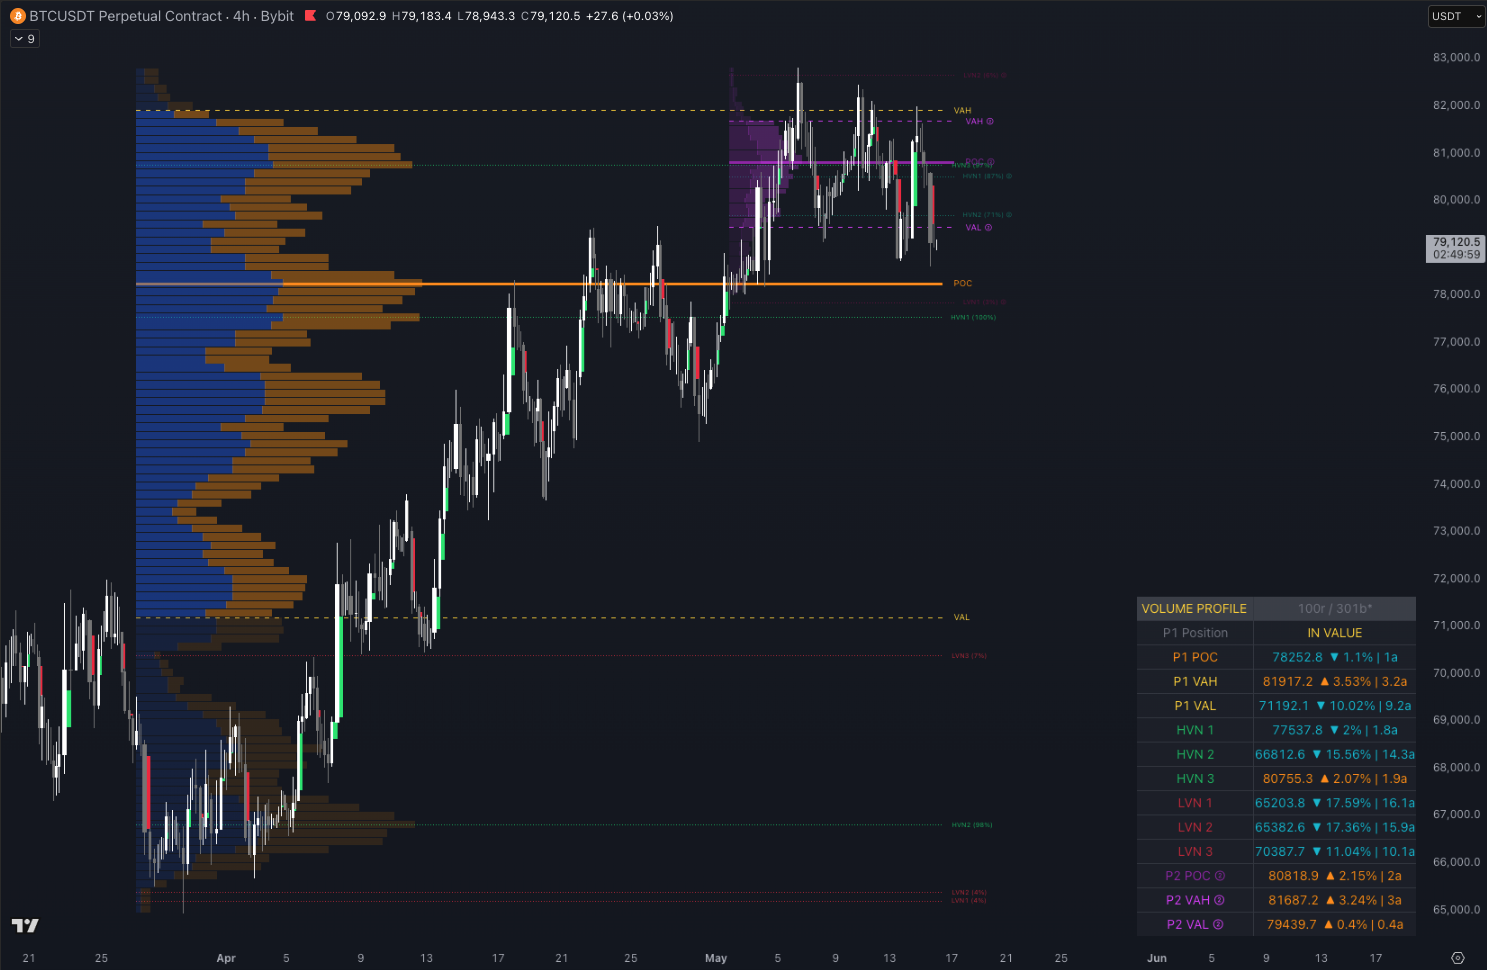
Volume Profile Pro
See Where the Market Really Traded Before You Enter
View Details →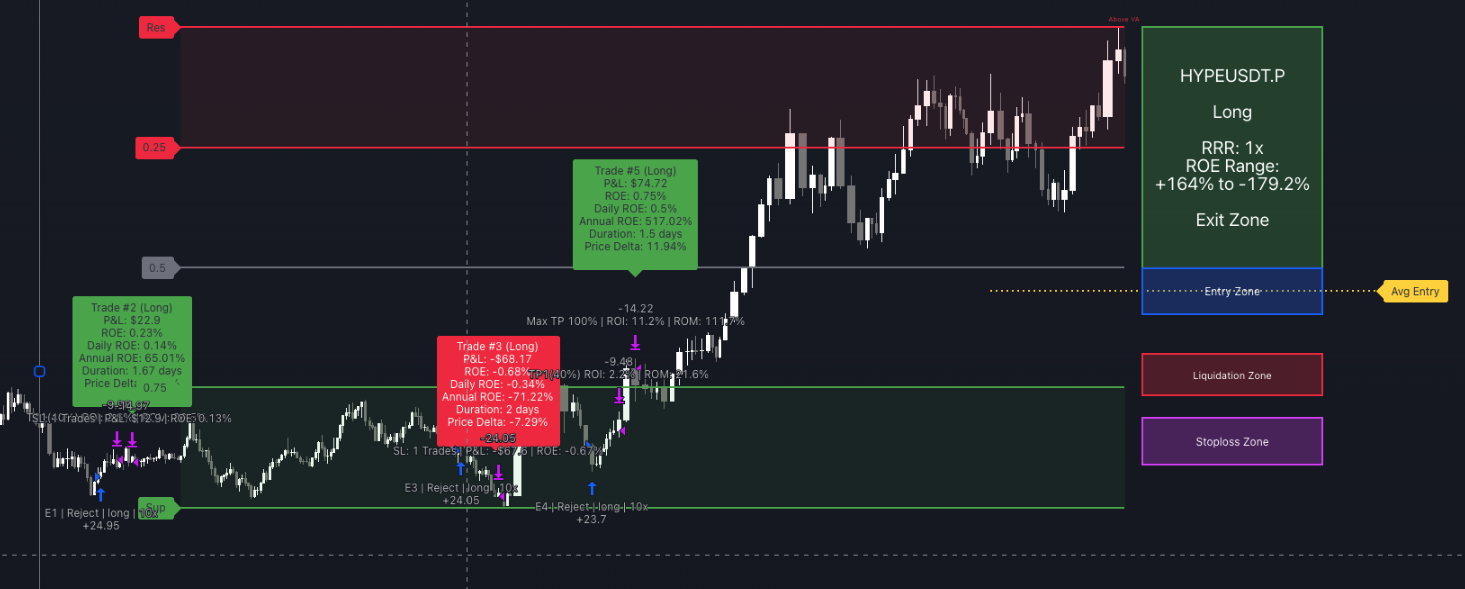
SignalEngine Pro
Automate Your Entries, TP Ladder, and Exits on Any Chart
View Details →